Sliceplorer evaluation results
Determine range
We want to understand what are the range of possible values that the function can take on?
Click on the tabs below to see examples of the different datasets viewed with the different techniques. The individual images can be clicked for a larger version.

Solution descriptions
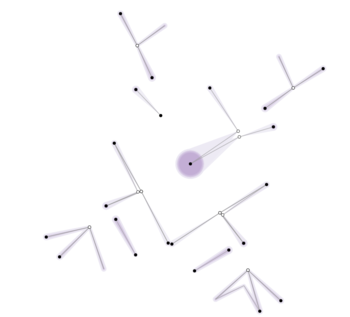
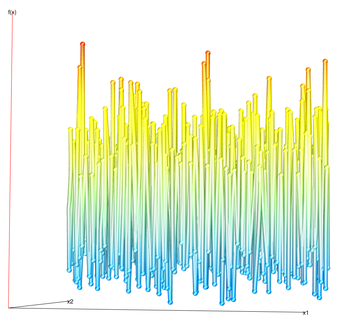
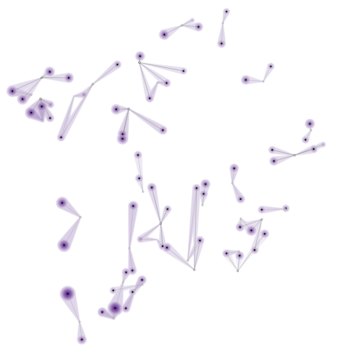
Gerber et al.
Visualizing the Morse-Smale complex makes it easy to see the various extrema of the functions, particularly the global maximum and minimum. This visualization method makes it easy to read the exact function values off the position of the point with respect to the y-axis.
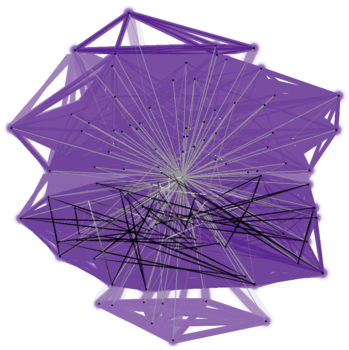
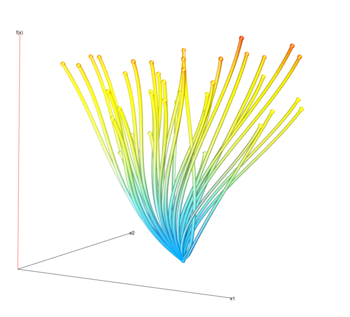
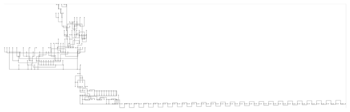
Contour tree
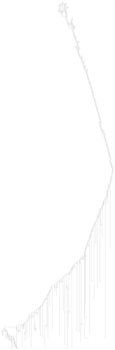
Topological spine
The problem with detecting the range with topological spines is that we can examine either the maxima or minima but not both.
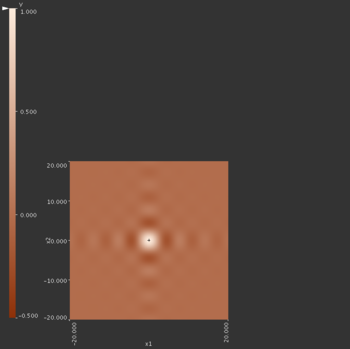
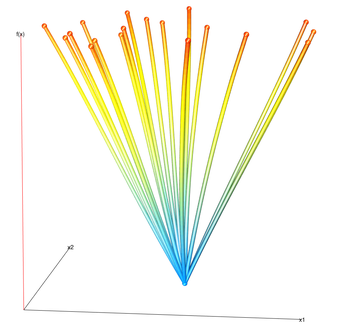
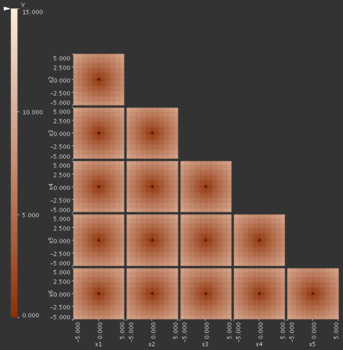
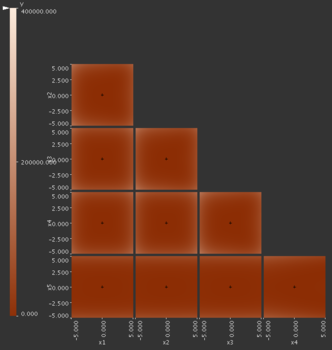
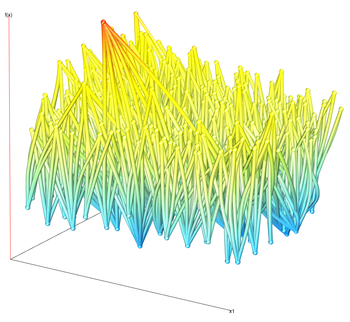
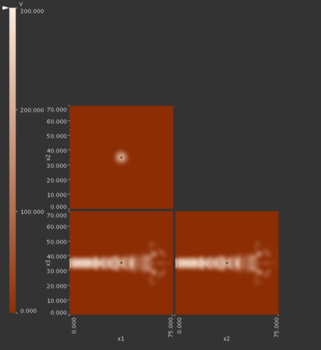
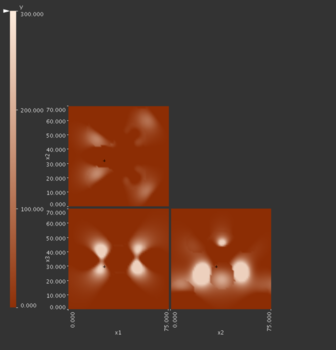
HyperSlice
In order to understand the full range of values that the function can take on we must browse through all possible focus points. We don’t have any additional navigation support with the base HyperSlice view so there is no indication as to where the global maxima and minima are. Once we find these values we can compute the range.
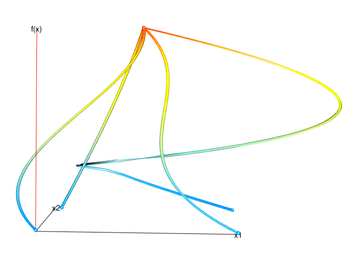
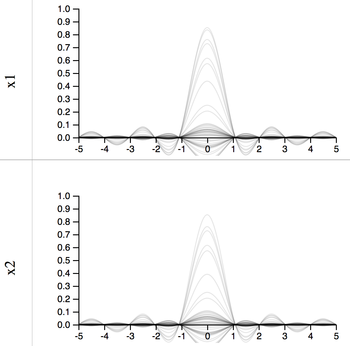
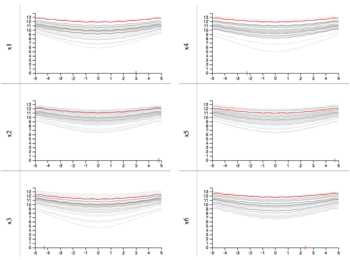
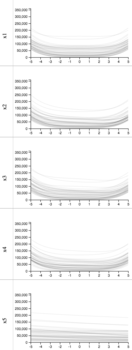
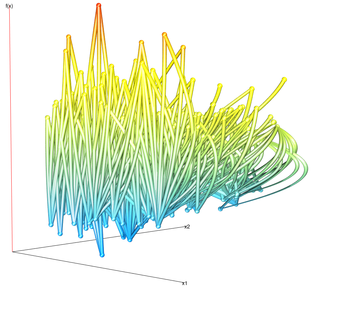
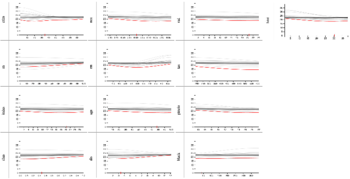
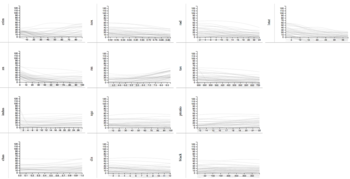
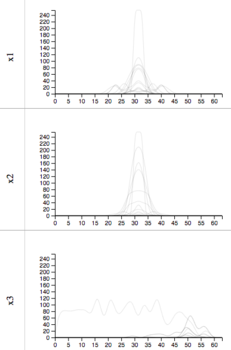
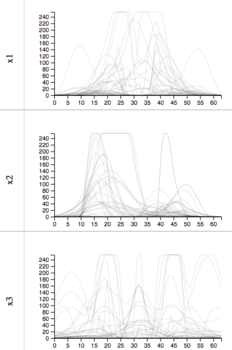
1D slices
With the projected slices it is easy to read off the different ranges of the function.