Sliceplorer evaluation results
Find anomalies
We want to find any particular manifolds that differ from the others. This differs from single point outliers because we are looking for function shapes. Single points can be found with discrete methods.
Click on the tabs below to see examples of the different datasets viewed with the different techniques. The individual images can be clicked for a larger version.


Solution descriptions
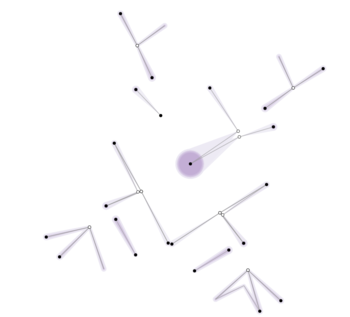
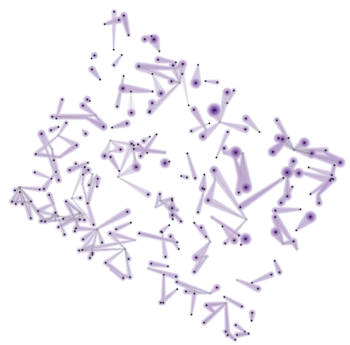
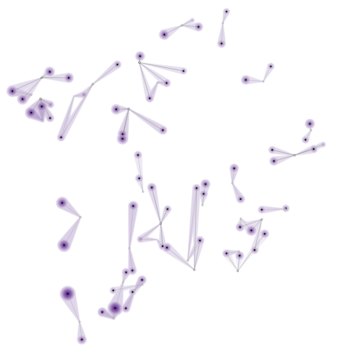
Gerber et al.
The Morse-Smale complex visualization can be used to view exceedingly high or low valued extrema in the function. However, any correspondence to function shape is lost. Because of the warping of the input parameter space into two dimensions for visualization, we cannot see which parts of the function stand out from the others.
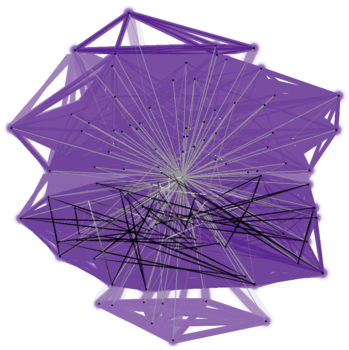
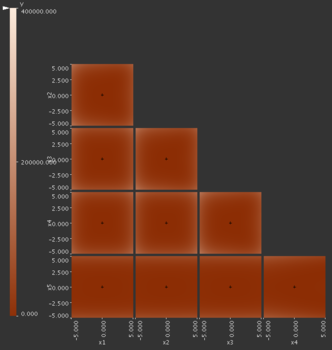
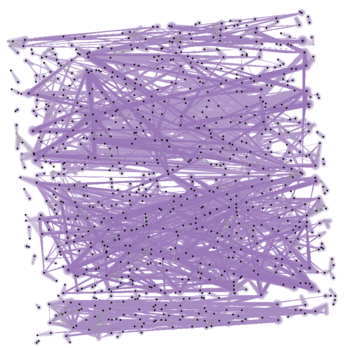
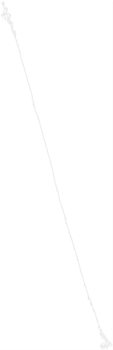
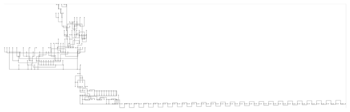
Contour tree
The graph layout algorithm tries to lay out the tree so that the y-position of the nodes relates to the function value. Because the spatial locations of the points are not taken into account it is very difficult to see if there are areas of the manifold that stand out from others.
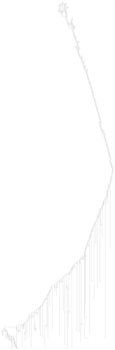
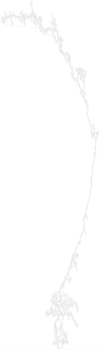
Topological spine
The general shape of the function is abstracted away in the topological spine view making it impossible to find outlier function behavior.
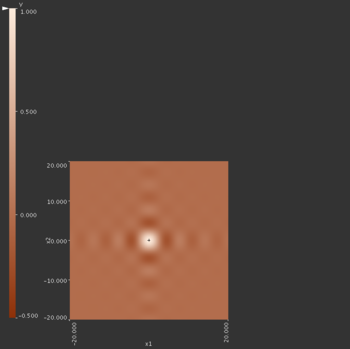
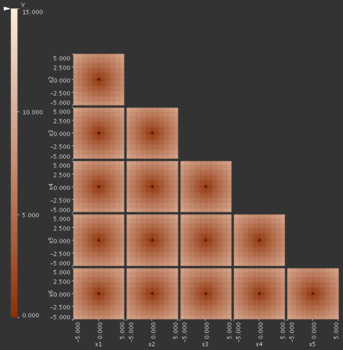
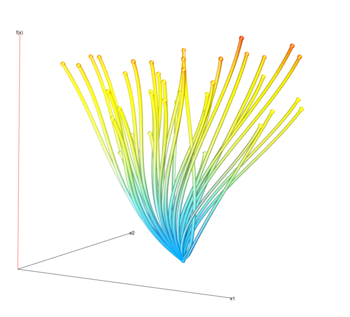
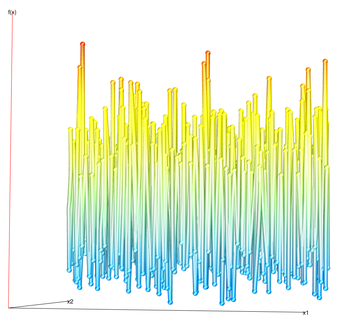
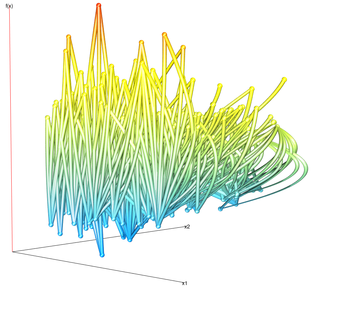
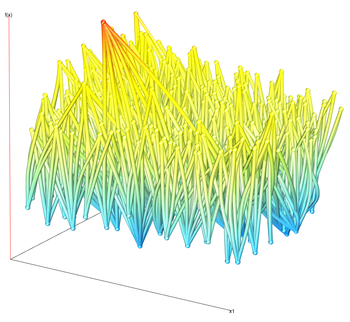
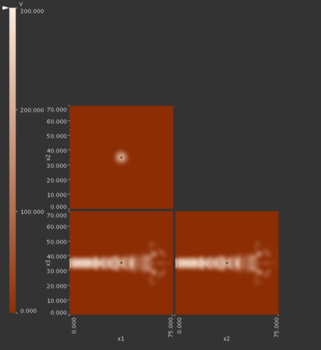
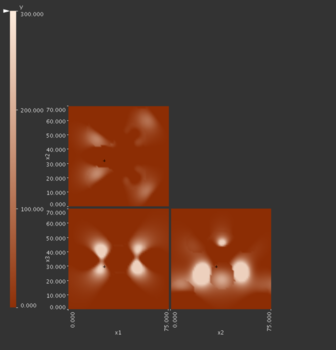
HyperSlice
In order to detect anomalous slices using the HyperSlice view we must get a global understanding of the function. That way we can see which slices stand out from the others. Without any navigation support of which focus points we have and have not seen this is no easy task.
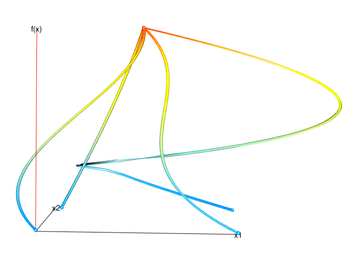
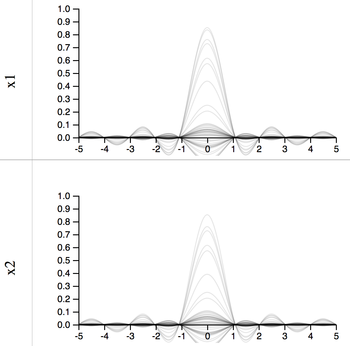
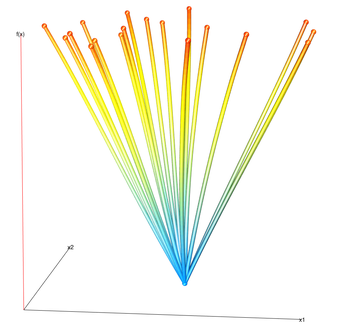
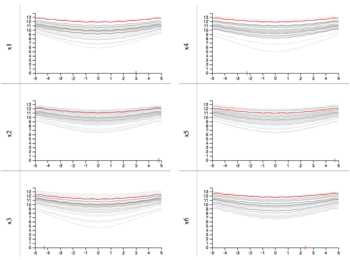
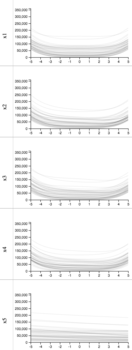
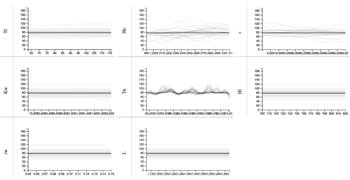
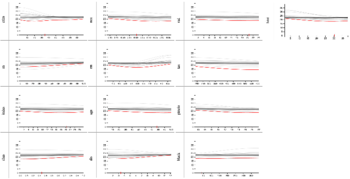
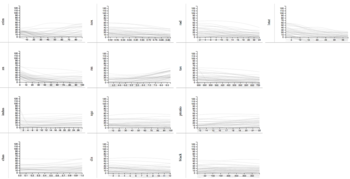
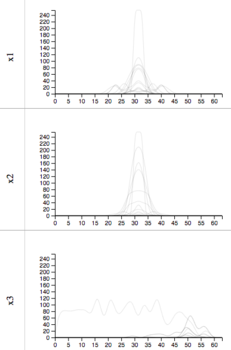
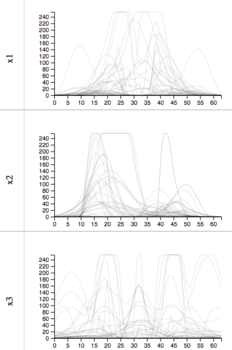
1D slices
The global view of 1D slices allows us to quickly identify slices that stand out from others.