Sliceplorer evaluation results
Retrieve value
With the lookup task, we find a particular input parameter setting and then discover what y-value this corresponds to. This is equivalent to evaluating the function at a certain input value and recording the output.
Click on the tabs below to see examples of the different datasets viewed with the different techniques. The individual images can be clicked for a larger version.


Solution descriptions
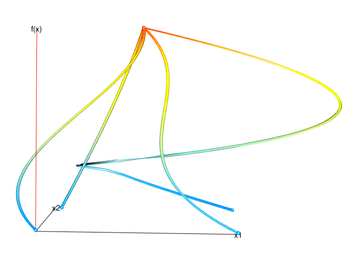
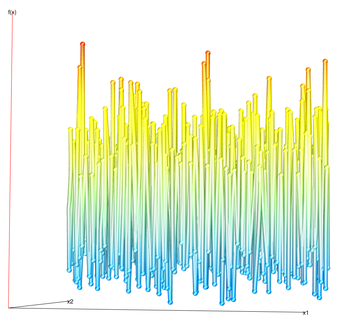
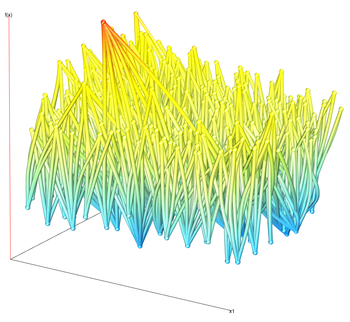
Gerber et al.
This is very close to a direct visualization of the Morse-Smale complex of the function. The Morse-Smale complex only shows the critical points of the function: the maxima, minima, and saddle points. Here we can identify these points. however there is no way to recover the input values corresponding to these points. While there are 2 x-axes (labelled x1 and x2), these are a non-linear warping of the input space into 2 dimensions for visualization purposes and have no correspondence to the original input dimensions. The curve shown between the critical points is an estimation of the curvature of the function in high dimensions but doesn’t represent its true behavior.
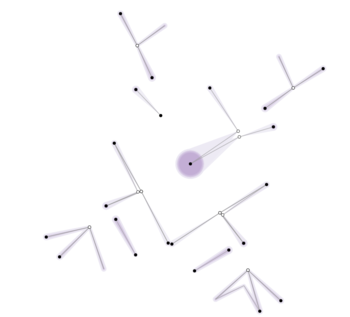
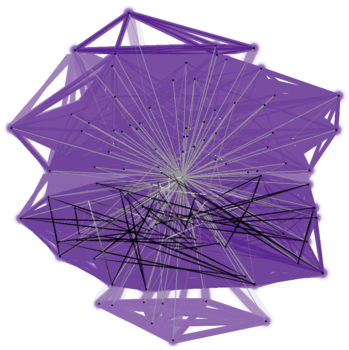
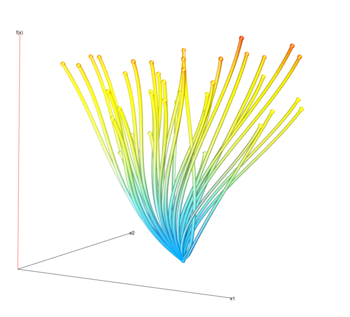
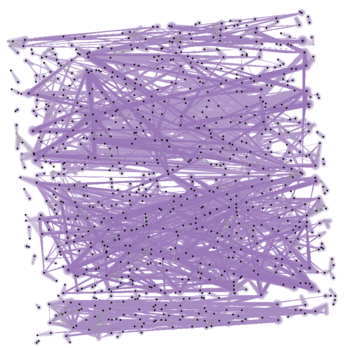
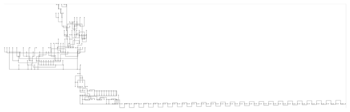
Contour tree
The 6D Ackley function has many local minima and maxima and this is reflected in the complexity of the tree. The graph layout algorithm tries to lay out the tree so that the y-position of the nodes relates to the function value. The contour tree only shows extrema and saddle points so these are the only points possible for which we can find the function value. In addition, since the points have no particular organization with respect to their input values one must scan through all the points to find a particular input value configuration.
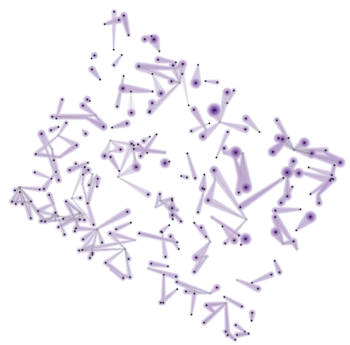
Topological spine
Like other topological techniques, topological spines only shows the extrema and saddle points. In addition it can either show maxima or minima, but not both. Therefore, only these points can be queried.
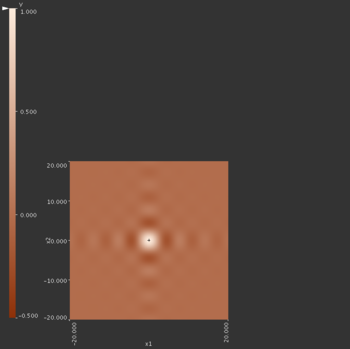
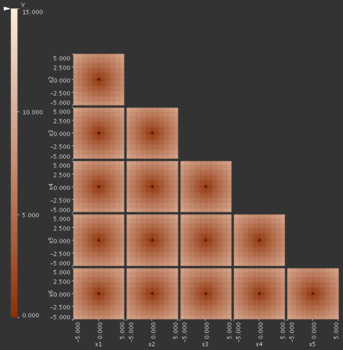
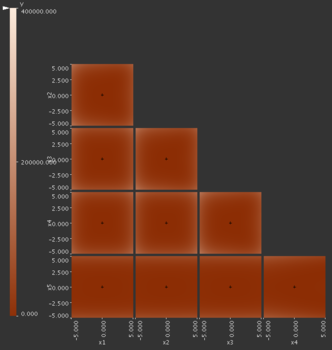
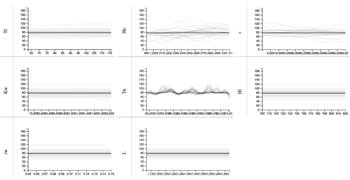
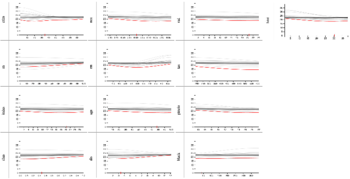
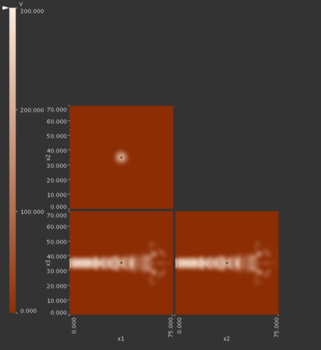
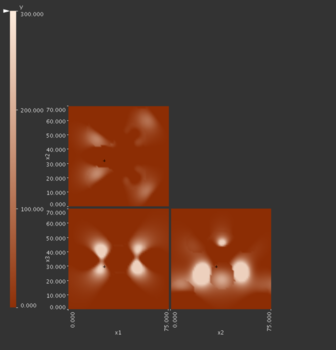
HyperSlice
Looking up a particular value with the HyperSlice method is very easy. We set the focus point to the desired input parameter configuration. Then, we can simply read the value of interest off the chart.
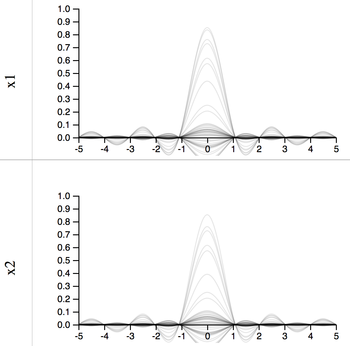
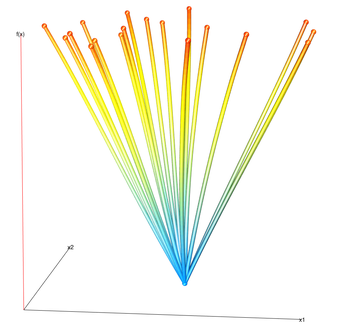
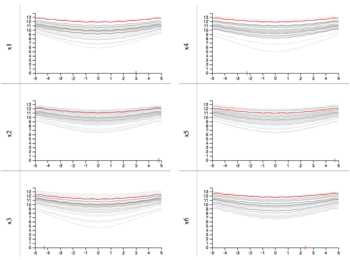
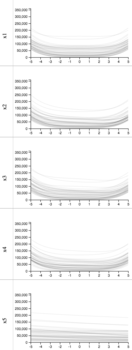
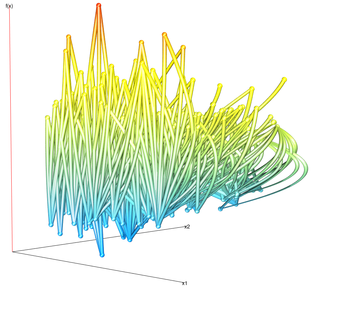
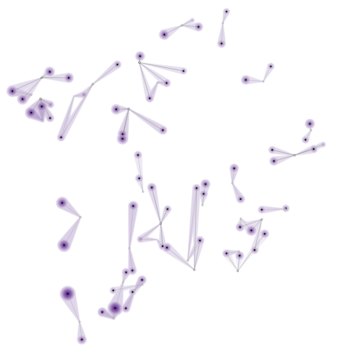
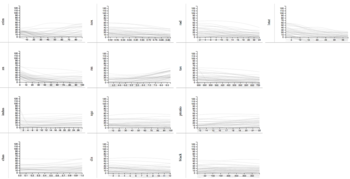
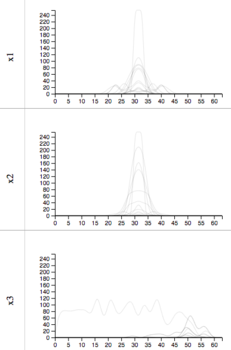
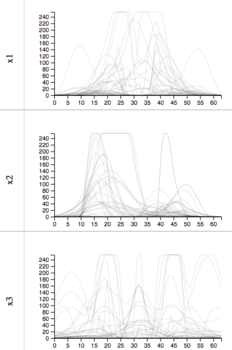
1D slices
In Sliceplorer the user can mouse over the x-axis of one of the plots and the slice corresponding to the closest focus point to that location will be highlighted in red. The location of the focus point is also indicated on the x-axis in the other plots. From this, the user can read off the fucntion value from the slice. However, this can only be done for slices related to the sampled focus point.