Sliceplorer evaluation results
Find extrema
What and where are the maxima and minima of the function under examination? Can we find the global minimum and maximum as well?
Click on the tabs below to see examples of the different datasets viewed with the different techniques. The individual images can be clicked for a larger version.

Solution descriptions
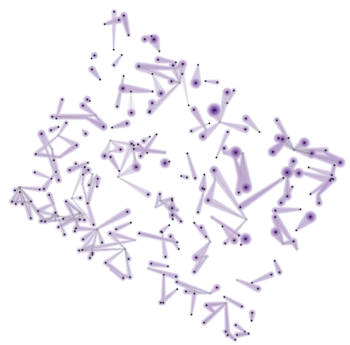
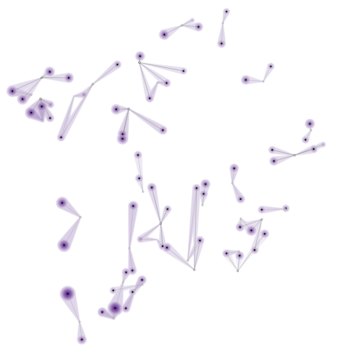
Gerber et al.
Visualizing the Morse-Smale complex lets us extract all extrema from the function and view only them. It is easy to see with this plot how many and what is the function value of each extremum.
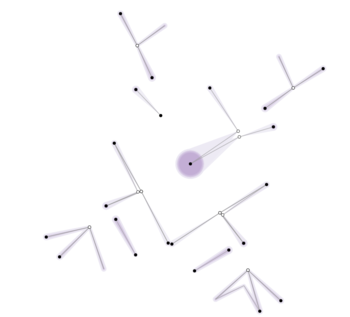
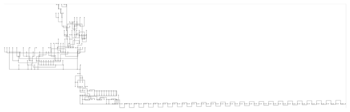
Contour tree
The graph layout algorithm tries to lay out the tree so that the y-position of the nodes relates to the function value. Because of this layout, finding the global maximum and minimum nodes is easy. We find the highest and lowest nodes in the display.
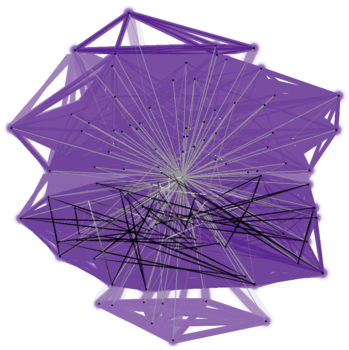
Topological spine
Like other topological techniques, topological spines focuses on the extrema from the function. Thus, this is well-supported.
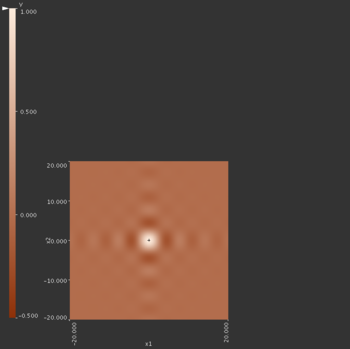
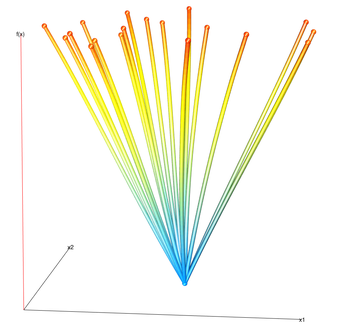
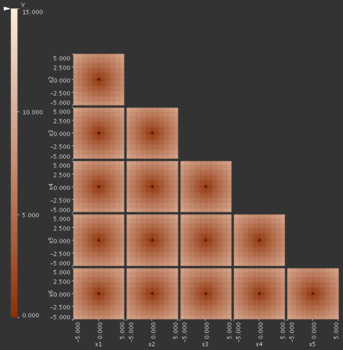
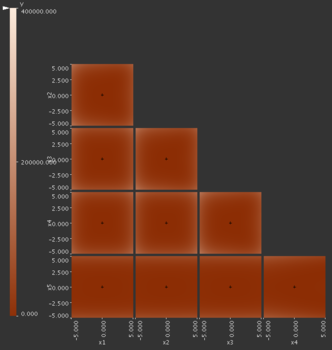
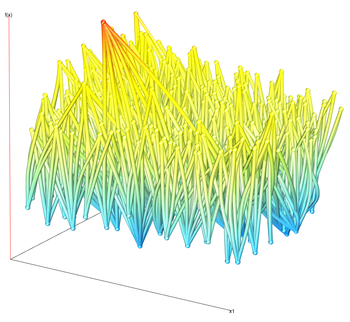
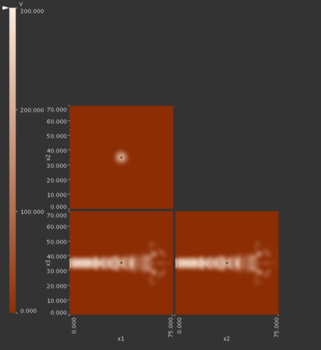
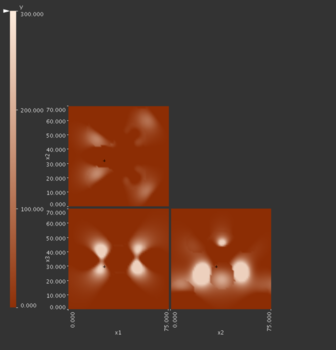
HyperSlice
Within each slice we can see the higher and lower values of the function. However, it is not clear how to set the focus point in order to navigate to these points. Some sort of navigation aid is required. Otherwise the user must tediously browse through all possible focus points to find the global minima and maxima.
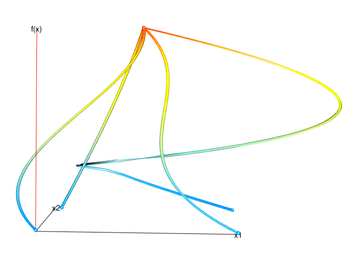
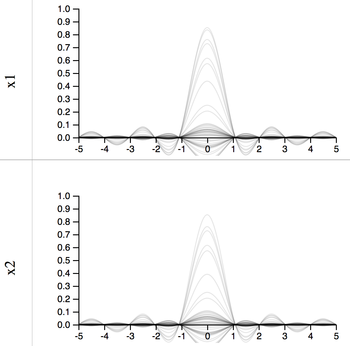
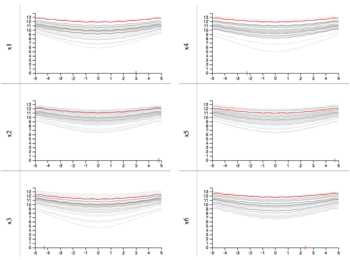
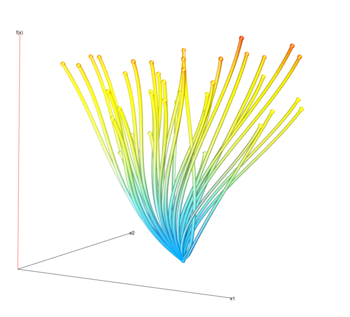
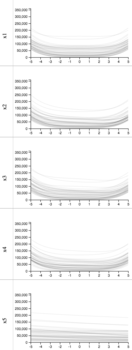
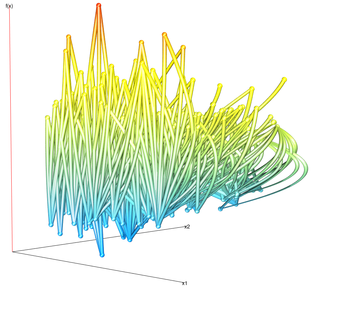
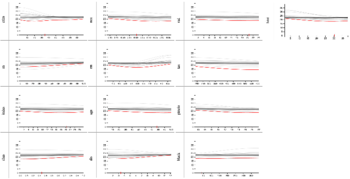
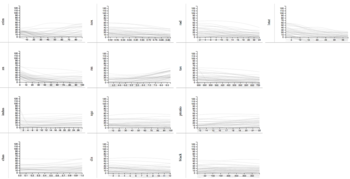
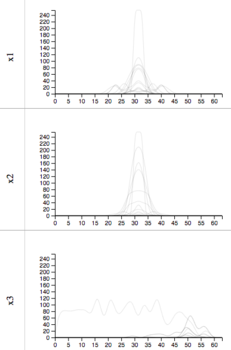
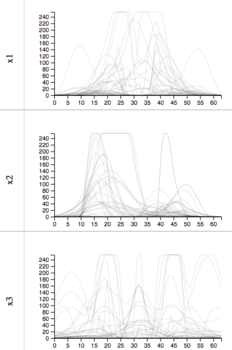
1D slices
The projected slices view we can see all sampled slices of the function. The global minimum and maximum can be read directly off the chart. We can also see the number and y-value of the any additional local minima of the function.