Sliceplorer evaluation results
Characterize distribution
Does the function only have one type of behavior? How many different types of behaviors does it have?
Click on the tabs below to see examples of the different datasets viewed with the different techniques. The individual images can be clicked for a larger version.
Solution descriptions
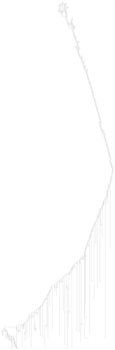
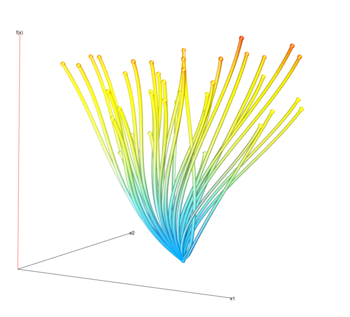
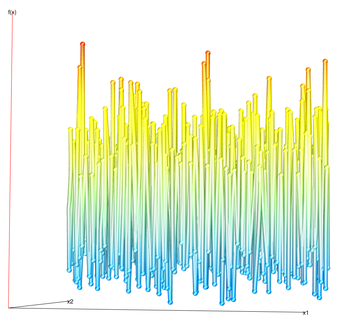
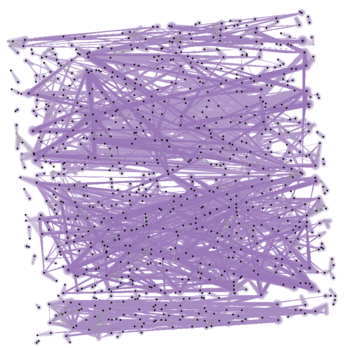
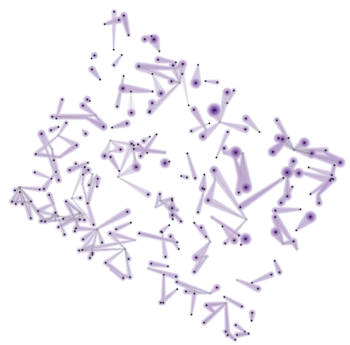
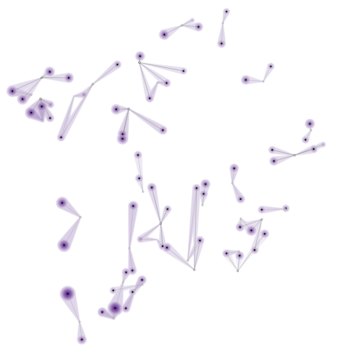
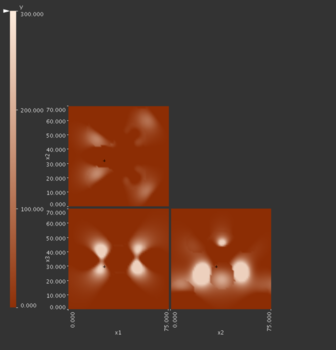
Gerber et al.
The non-linear mapping of the input parameters into two dimensions for visualization purposes makes it impossible to detect any “shape” of the original function manifold.
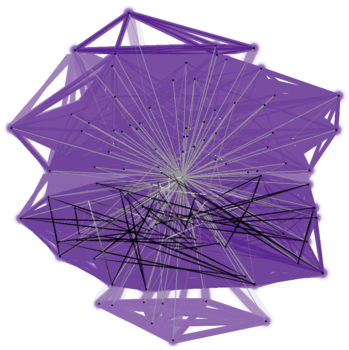
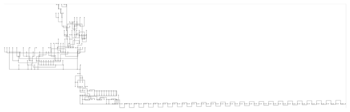
Contour tree
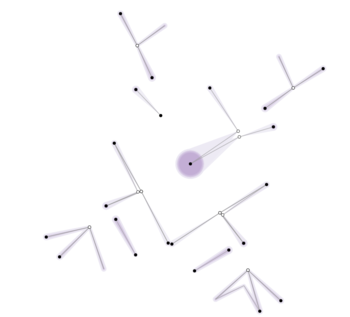
Topological spine
Since the topological spines technique abstracts away the underlying function it’s not possible to evaluate the distribution of function behaviors.
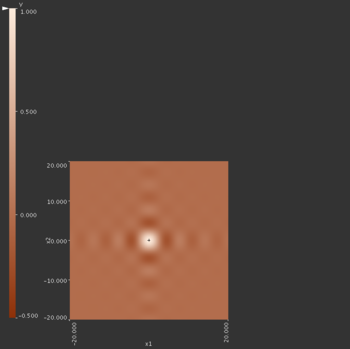
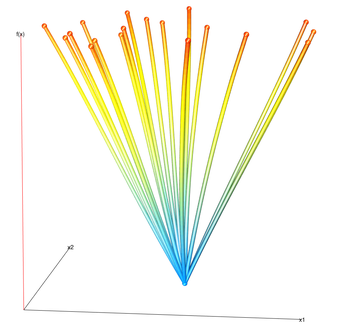
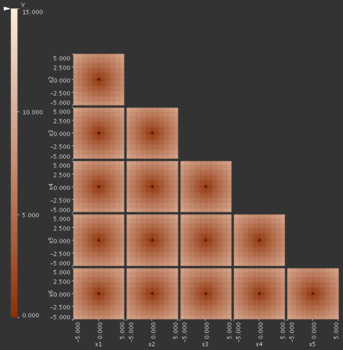
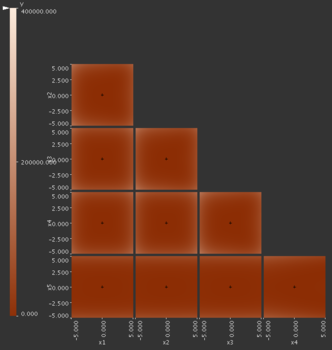
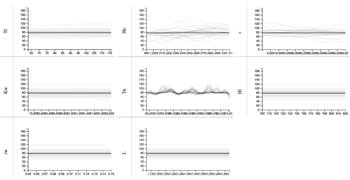
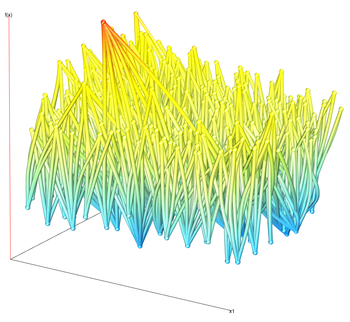
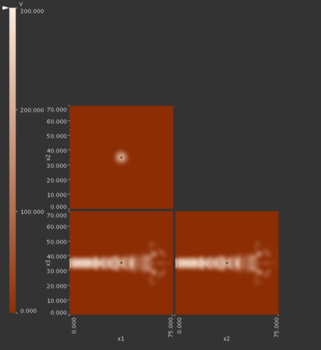
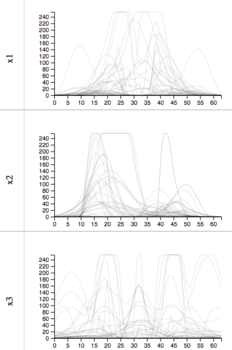
HyperSlice
We need to see many slices of the funciton in order to get a global understanding of the types of shapes that the manifold can have. The HyperSlice view shows a single slice at at time in each direction so we must tediously browse through all possible focus points in order to understand the distribution.
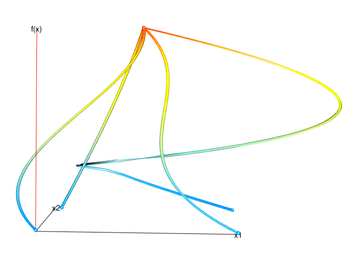
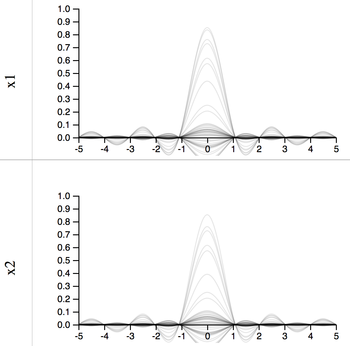
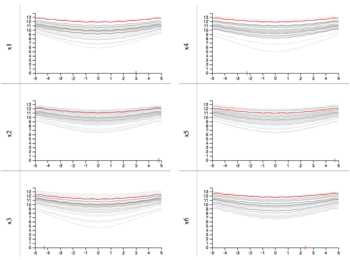
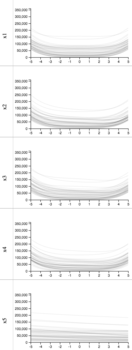
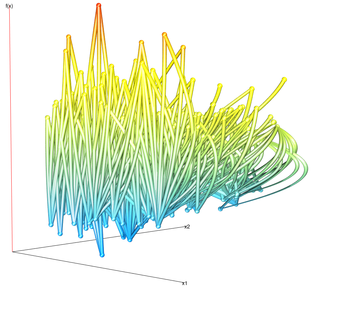
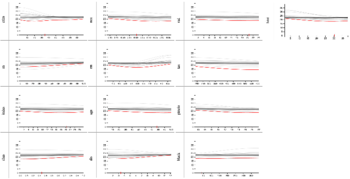
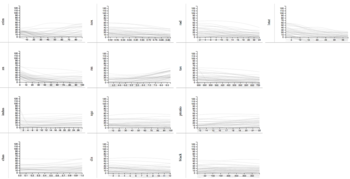
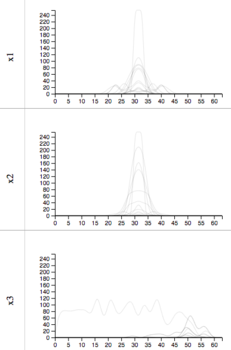
1D slices
Here we can directly see the shapes of the function in the projection view.