Sliceplorer evaluation results
Correlate
We want to understand if any change in function value is due to varying a single paramter or two parameters at once.
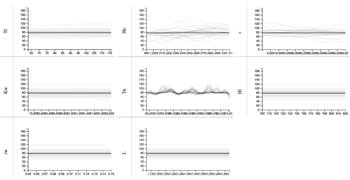
Click on the tabs below to see examples of the different datasets viewed with the different techniques. The individual images can be clicked for a larger version.


Solution descriptions
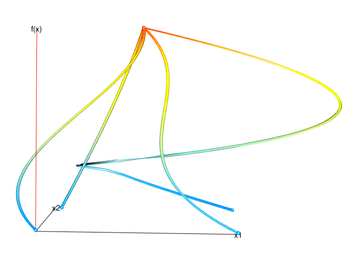
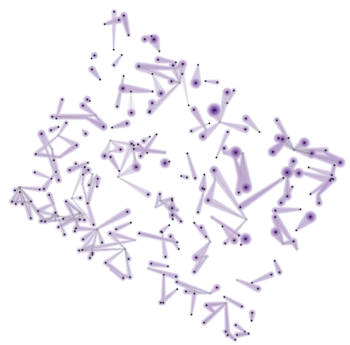
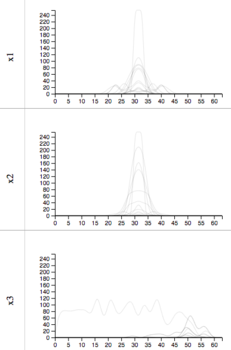
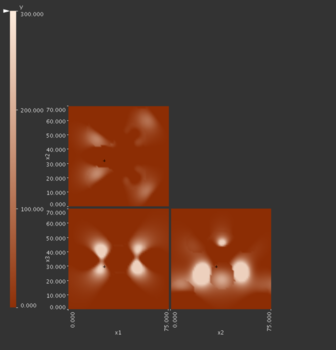
Gerber et al.
With this visualization technique the multi-dimensional space is mapped via a non-linear mapping into the two axes used for visualization: x1 and x2. It is not really possible to back out what, if any, behavior due to the combination of x1 and x2 in the graph is due to the variation of one, two, or multiple combinations of parameter values in the original function.
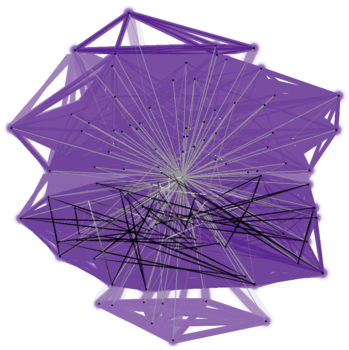
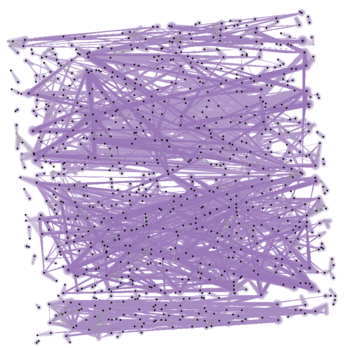
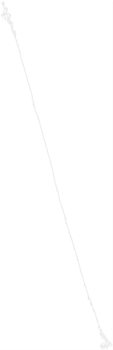
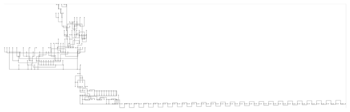
Contour tree
The contour tree does not take the spatial locations of the input samples into account. Therefore, it is not possible to discern either one-dimensional or two-dimensional relationships between the input factors and the output value.
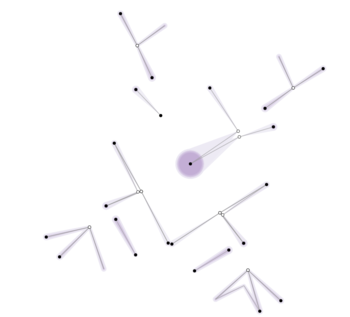
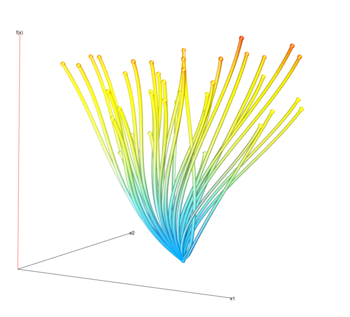
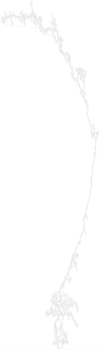
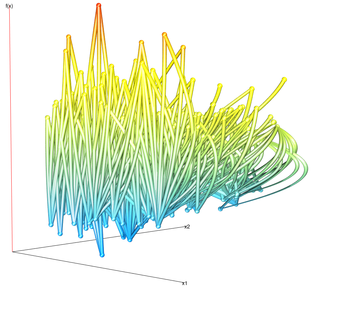
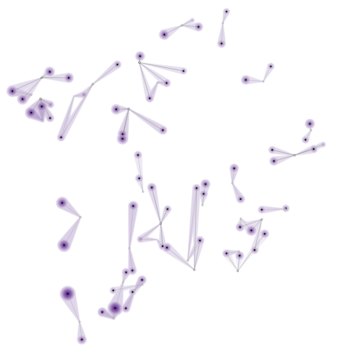
Topological spine
With the correlate task it is vital to see the input parameter space somehow in order to judge whether any change in function value is due to changes in a single parameter or multiple parameters at once.
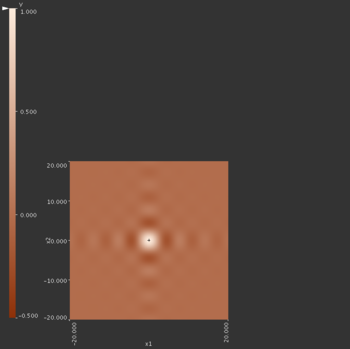
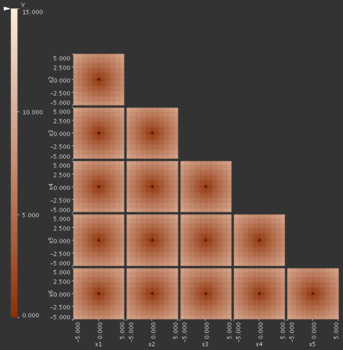
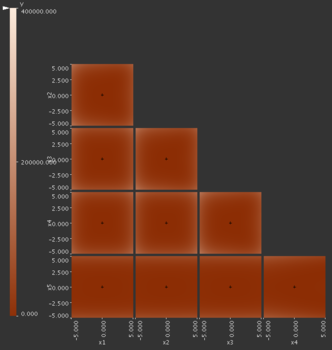
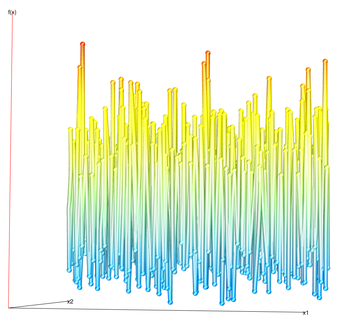
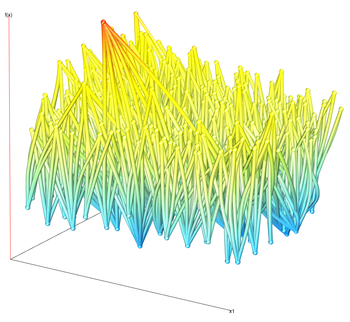
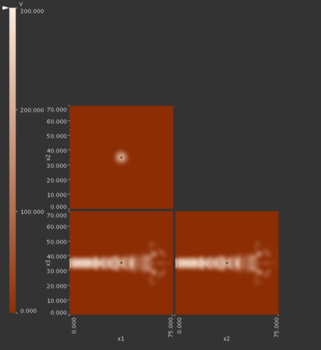
HyperSlice
The HyperSlice view shows a 2D slice. It is easy to see the influence of each parameter and their combination by looking at the view directly.
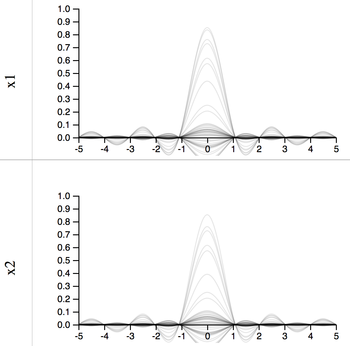
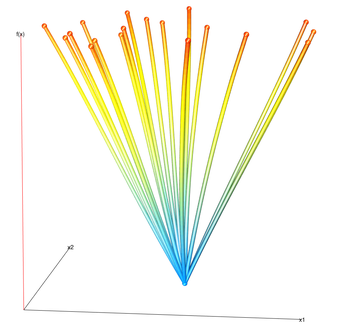
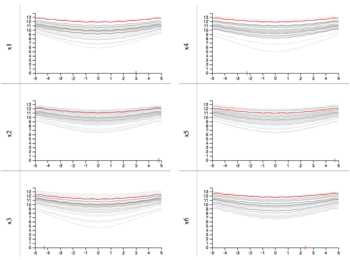
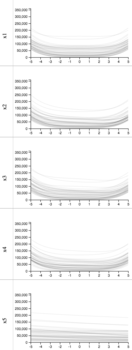
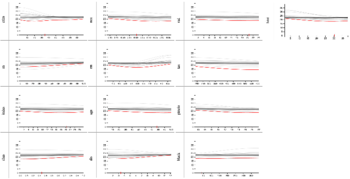
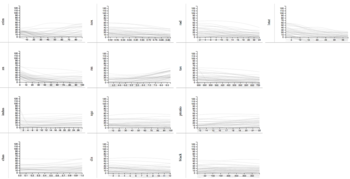
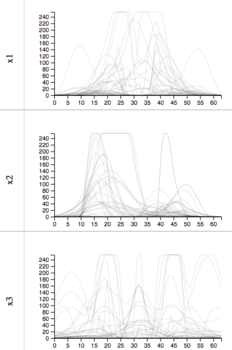
1D slices
Here we would like to understand what factors are contributing to the overall value. We can investigate one slice at a time (as the image shows) but that does not give a good intuition overall as to which, if any factors contribute in combination to any behavior.