Sliceplorer evaluation results
Cluster
Which parts of the manifold have similar shapes? Can we group these areas together?
Click on the tabs below to see examples of the different datasets viewed with the different techniques. The individual images can be clicked for a larger version.


Solution descriptions
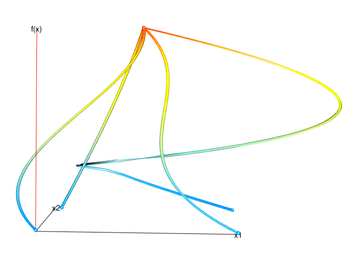
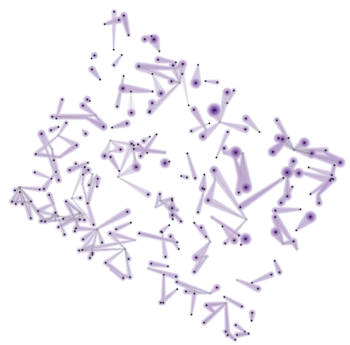
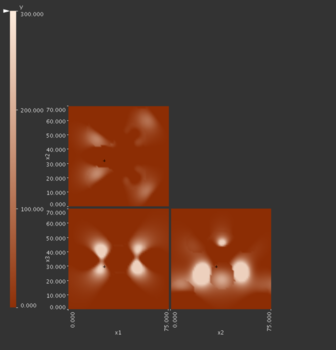
Gerber et al.
We can see some patterns in the function behavior here. The Morse-Smale complex extracts all critical points from the graph. This visaulization method uses a non-linear mapping of the full (multi-D) input parameter space to two-dimensions for visualization. These are the x1 and x2 axes. This mapping tries to put points that are close in the parameter space will be close in the visualization. Therefore, we will be able to see repeated patterns of extrema in the manifold in this visualization.
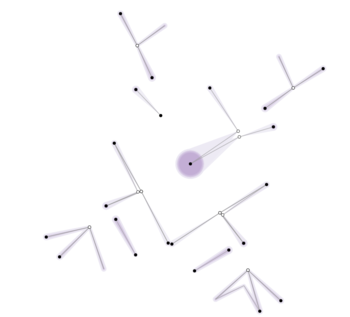
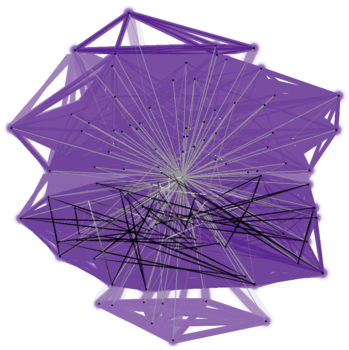
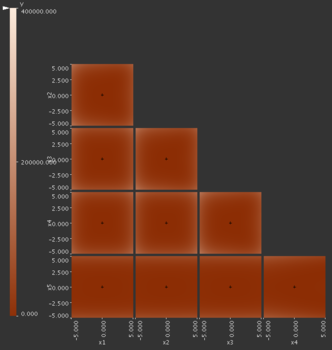
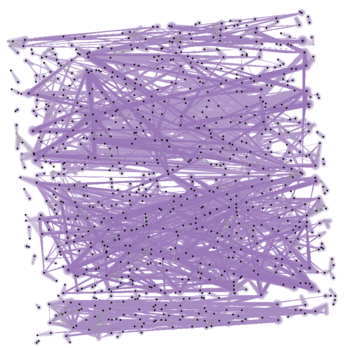
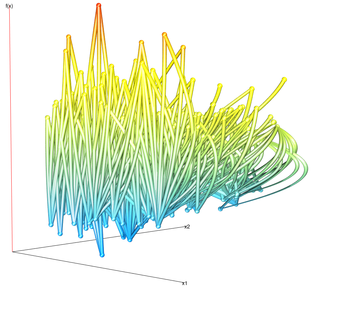
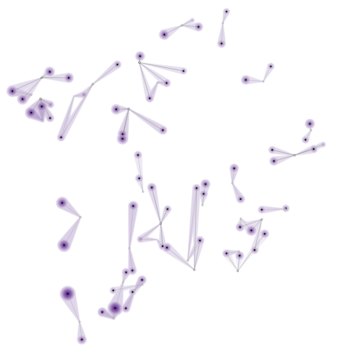
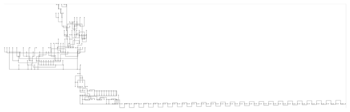
Contour tree
While the contour tree does not take the spatial locations of the input samples into account, we would expect to see repeating patterns of saddle and extrema due to the periodic behavior of the Ackley function. One can see some of this, for example, in the upper part of the graph where we can see similar-looking 3 branch tree structures. However, without knowing beforehand that these patterns exist it is not easy to understand what these repeating patterns mean.
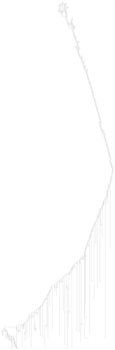
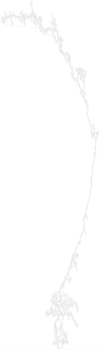
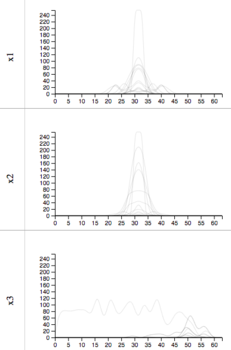
Topological spine
The general shape of the function is abstracted away with the topological spines technique. If one cannot see the shape of the function then it’s not possible to group those shapes together.
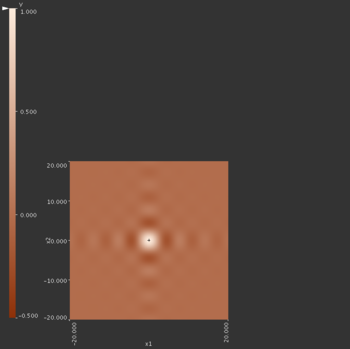
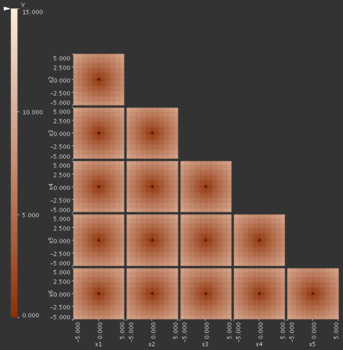
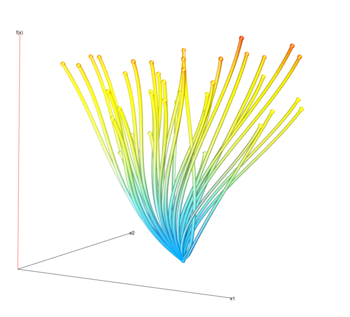
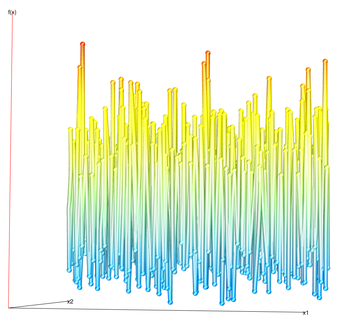
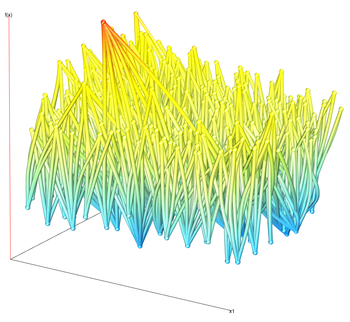
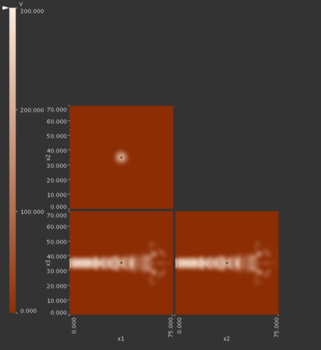
HyperSlice
In order to divide the function into different areas of behavior. The HyperSlice view has no direct support for this. We can do it mentally but we must carefully navigate through all possible focus points to build up a global understanding of the function.
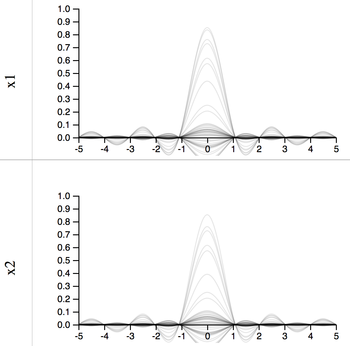
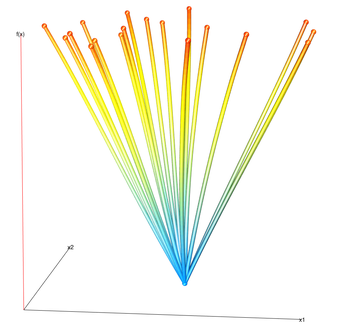
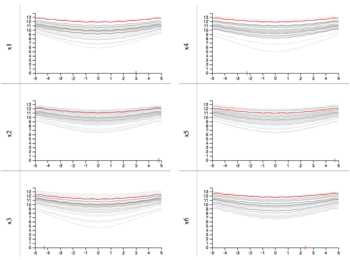
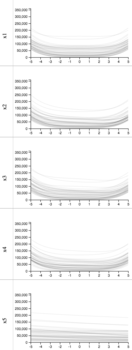
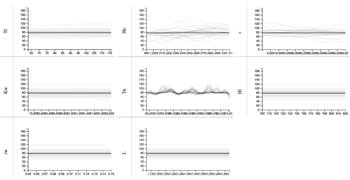
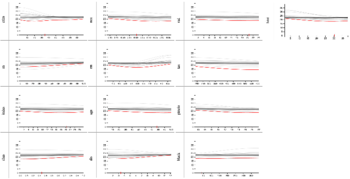
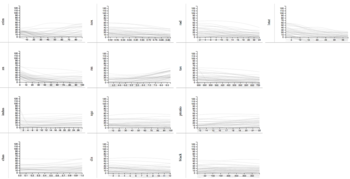
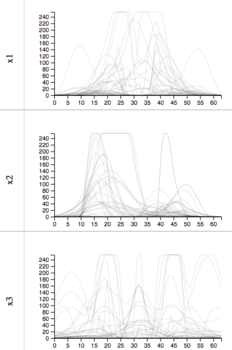
1D slices
The 1D slice views can show colored clusters but the user can also visually cluster the function into groups.